How do we measure quality in OSM?
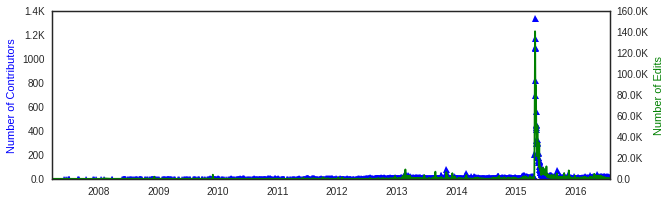
Can you guess the Country with this editing behavior?
Answer
There are many ways to explore notions of quality* in both OpenStreetMap (OSM) and Volunteered Geographic Information (VGI) projects in general. The most common methods involve comparing attributes (position, spatial density) of the data to other geospatial datasets acting as a truth. These assessments are typically done using proprietary government survey data or commercial data and make up the bulk of the reports surrounding quality assessment in VGI, consider just the titles, for example of the following articles:
Comber, A., See, L., Fritz, S., Velde, M. Van der, Perger, C., & Foody, G. (2013). Using control data to determine the reliability of volunteered geographic information about land cover. International Journal of Applied Earth Observation and Geoinformation, 23(1), 37–48.
Haklay, M. (Muki) M. (2010). How good is volunteered geographical information? A comparative study of OpenStreetMap and ordnance survey datasets. Environment and Planning B: Planning and Design, 37(4), 682–703.
Zielstra, D., & Zipf, A. (2010). A Comparative Study of Proprietary Geodata and Volunteered Geographic Information for Germany. In AGILE International Conference on Geographic Information Science. Guimarães, Portugal.
While this seems like, and certainly is, a valid method for assessing OSM data, how do we explore notions of quality in places where authoritative reference datasets do not exist or are prohibitively difficult to obtain? (In many of these places, it is arguably even more important to have high quality OSM data because it may be the only source of geospatial data). To perform quality assessment without reference datasets, we need different methods which rely solely on the attributes of the data itself: intrinsic quality metrics.
*Defining quality itself is very difficult. Quality measurements in OSM and geospatial data typically include measurements of completeness and positional, temporal, or semantic accuracy. Quality in OSM is highly contextual: different uses of OSM data require different metrics of quality.
Intrinsic Quality Metrics
In their simplest form, these could look at the relative density of features in a given area, or the recency of when the edit occurred. These offer a very different measurement of quality compared to completeness or positional accuracy, but can certainly provide insight when exploring where and when contributions are occurring, a potential proxy for how recently the data was updated and how many eyes of validated that part of the map.
Here are two examples of exploring simple intrinsic quality metrics:
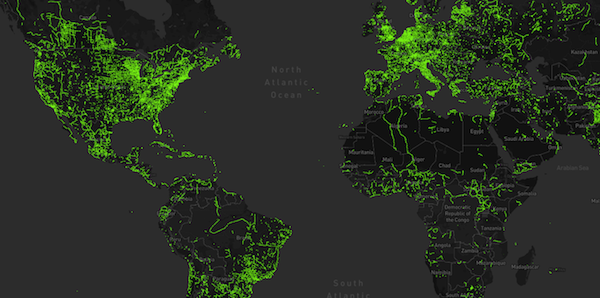
Annual Density of Contributors and their Edits in OSM
This heatmap of z12 tiles across the globe is styled according to the number of edits and active contributors on each tile. The data is aggregated annually, so you can see which tiles are receiving the most attention on any given year.
Exploring the When of OpenStreetMap:
Annual Edit Recency
This map shows when (annually) the latest edit occurred on a tile. Tiles that are frequently edited will always have edits towards the end of the year and will appear red, while some tiles may be edited early in the year and then not touched by other contributors in that year (appearing lightblue). This map shows this behavior between 2005 and 2016.
Intrinsic Quality Metrics: What are the objects?
Another form of intrinsic quality compares semantic and contextual attributes of each object. By counting the existence of specific tags in the data, we can count and visualize where specific types of data are being edited.
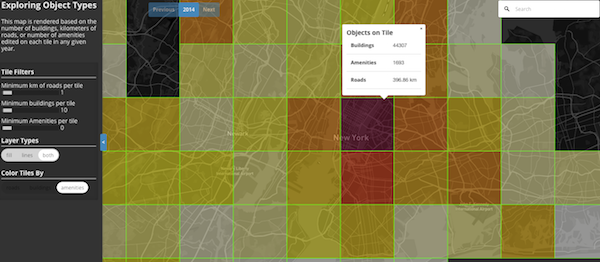
Exploring the What of OpenStreetMap:
Where are the roads, buildings, and amenities?
This heatmap can show either the total kilometers of road, number of buildings, or amenities edited on each tile for any given year.
The Named Road Metric:
Where are the highly edited and named roads?
The international road network currently consists of over 20 million named road segments and 70 million unnamed road segments, all with varying lengths. Does the simple existence of a name tag on a highway imply it is data of a higher caliber that is validated by local knowledge? This map shows where these named roads are in reference to the unnamed road segments.
Intrinsic Quality Metrics: The Contributor
I think that what makes OpenStreetMap data so much more interesting than other geospatial datasets is the extra metadata associated with each object that records who edited it, when the edit happened, and how many times it has been modified. The main question surrounding quality then becomes: Can we use these User-Centric attributes to explore different notions of data quality?
University of British Colombia Geography PhD candidate and research scientist at Stamen, Alan McConchie explores the idea of map gardening in his current PhD work. Borrowing this term from Wikipedia literature, the idea is to identify differences in editing patterns across the map between contributors adding new data to the map and contributors editing existing data, effectively maintaining the map.
Building from this, can we identify specific areas on the map where contributors take personal ownership and exhibit this type of maintenance behavior?
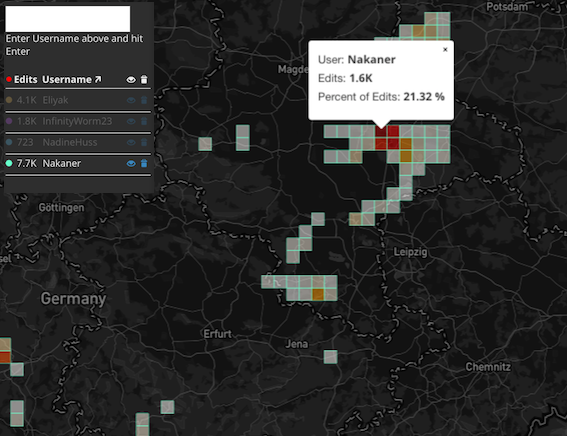
Contribution Summaries:
Where does each user contribute to the map?
This tool visualizes a user’s top 100,000 edited z12 tiles on any given year, rendering a heatmap based on the number of objects they edited on each tile. Interestingly, almost all users tend to have a single tile or group of few tiles that comprise a significant portion of their edits when compared to all of the tiles on which they edit.
Take, for instance, this user, Nakaner. Over 7,700 edits to the map in 2012, but 1,600 of these edits are all concentrated on a single tile, comprising 21% of this user's editing activity that year.
Further, are there groups of people that all exhibit this type of behavior around the same part of the map? If so, can we use this pattern of editing as a proxy for a group of map gardeners, or perhaps a healthy, vibrant, local OSM community that actively maintains their corner of the map?
Exploring this notion of collaborative map-gardening can be done through network analysis, looking finding areas of the map where the same users are consistently focusing on the same areas or similar features.
Intrinsic Quality Metrics: Co-Editing Networks
User Interaction Networks (North America):
Where do users consistently contribute alongside others?
This visualization builds co-editing networks where users are connected to one another if they share a specified number and type of edits on the same tiles. Two users could be connected if, for example, they both edited over 50 buildings on the same tile. A vibrant local OSM community with this behavior may show up as a clique of 5 or 10 users who’s similar edits are consistently co-located on the same map tile.
Putting these pieces together
Ultimately, the question to answer here is:
Can we identify map maintenance/ map gardening behavior by a local community (or a community with local knowledge) by combining these metrics?
I think so. First, let’s expand the type of intrinsic semantic analysis beyond just what is being edited to specific object attributes of each feature. That is, are contributors
- adding new objects or editing existing objects?
- editing roads or amenities with or without names?
- editing buildings with more than just a
building=yestag?
Note: While we may not have authoritative geospatial datasets for reference, other datasets can serve as proxy. Population and GDP statistics, for example, can be used to normalize the data. For this purpose, I ran per year, ran per user, per country statistics for this part.
Per Country User & Object Edit Detail:
Users creating or editing named vs. unnamed objects
This visualization explores the relationship between number of contributors, active editing days, and the types of objects that are edited as a result of their activity. Tile level data exists, but aggregating at a Country level allows for richer visual inspection over time – especially in areas where we see giant spikes in OSM contribution activity: Such as Haiti 2010, Philippines 2013, or most notably, Nepal 2015.
Next Steps
Each of these tools serves a purpose to explore the who of OpenStreetMap, but can a super metric be created by combining them in such a way that we can identify areas of the map with a high level of contributor oversight or areas which need to be improved?
Furthermore, OSM is a community effort and since these analyses investigate individual user contributions, how can we share these results in such a way as to continually foster a healthy, vibrant mapping community?